Chart
Charts reflect the changes in the price of a financial instrument over a time. They are widely used for graphical analysis, study of indicators and forecasting of the market price.
A user is provided huge opportunities to customize chart by applying chart settings and available tools like indicators, drawing tools, patterns, prediction and measurement tools, and many others. One can open orders and add Quote alerts directly from the Chart window.
Chart Settings
A user can enable the following options:
- Show Orders on Chart: Select this option to display order lines on the chart.
- Show Positions on Chart: Select this option to display positions on the chart.
- Show Positions TP/SL on Chart: Select this option to display positions Take Profit/Stop Loss on the chart.
Chart Custom Toolbar
Select the following options and customize the chart:
Periodicity. Time frame of the chart (from 1 minute to 1 month).
Chart Type. Visualization of the Bid/Ask price movements of the finance instruments represented in lines, columns, or another form (Bars, Candles, Line, Area, etc.).
Compare. Adding another symbol on the chart or comparing the market movements of 2 or more different symbols simultaneously. View the details how to add another symbol and how to compare symbols on the Chart.
Indicators. Statistics used to measure current market conditions and forecast economic trends (Aroon, Chop zone, EMA cross, UO, Zig Zag, etc.). View the details here.
Undo/Redo. Undo/ Redo of the recent changes.
Quote Type. The Bid quote type can be changed to Ask
.
Layouts. Chart layouts management. The layout can be saved, loaded, renamed and copied.
Chart properties. Chart properties including symbol bars colors, status lines (Symbol, OHLC, Indicator values, etc.), scales (Symbol/Indicator name label, No overlapping lable, etc.).
Fullscreen mode. Chart display that covers the full screen.
Snapshot. Possibility to save the image of the chart or copy the image url.
Drawings Toolbar
Cursors. Different shapes of cursors (Cross, Dot, Arrow, Eraser).
Trend Line Tools. Lines drawn over pivot highs/lows to show the prevailing direction of price (Trend line, Trend angle, Arrow, Ray, Extended). View the details here.
Gann and Fibonacci: Technical analysis tools developed by famous analysts Gann and Fibonacci (Pitchfork, Gann fan, Fin circles, Fib channel). View the details here.
Geometric Shapes. Various geometric shapes for selection of the areas of interest on the chart (Brush, Path, Rectangle, Curve, Arc, et.).
Annotation Tools. Simple tools of marking points of significance on the chart like high/low points (Text, Callout, Arrow marker, Flag mark, etc.).
Patterns. Pattern drawing tools allowing traders to visually identify chart patterns (ABCD patterns, Head and Shoulders, Elliott Impulse wave, etc.). View the details here.
Prediction and Measurement Tools. Prediction and measurement drawing tools (Forecast, Price range, Ghost feed, Projection, etc.). View the details here.
Icons. Graphical symbols (emoji/smiley) which can be placed whenever on the chart.
Measure. Measure tool to measure the distance between bars on the chart.
Zoom in. Zooming the chart in.
Magnets. Week magnet and Strong magnet. Magnet mode snaps drawings places near price bars to the closest OHLC value.
Stay in Drawing Mode. If enabled
, the drawing mode will be kept.
Lock all Drawing Tools. If enabled
, all the applied drawing tools will be locked on the chart and become uneditable.
Hide all Drawing Tools. If enabled
, all the applied drawing tools will be hidden on the chart.
Remove Drawings/Indicators. All the applied drawing and/or indicators can be removed from the chart.
Click a drawing tool icon to apply available settings to some of the drawing tools like font size, text color, background color, etc. 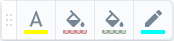
Click the swipe  to hide the Drawings toolbar.
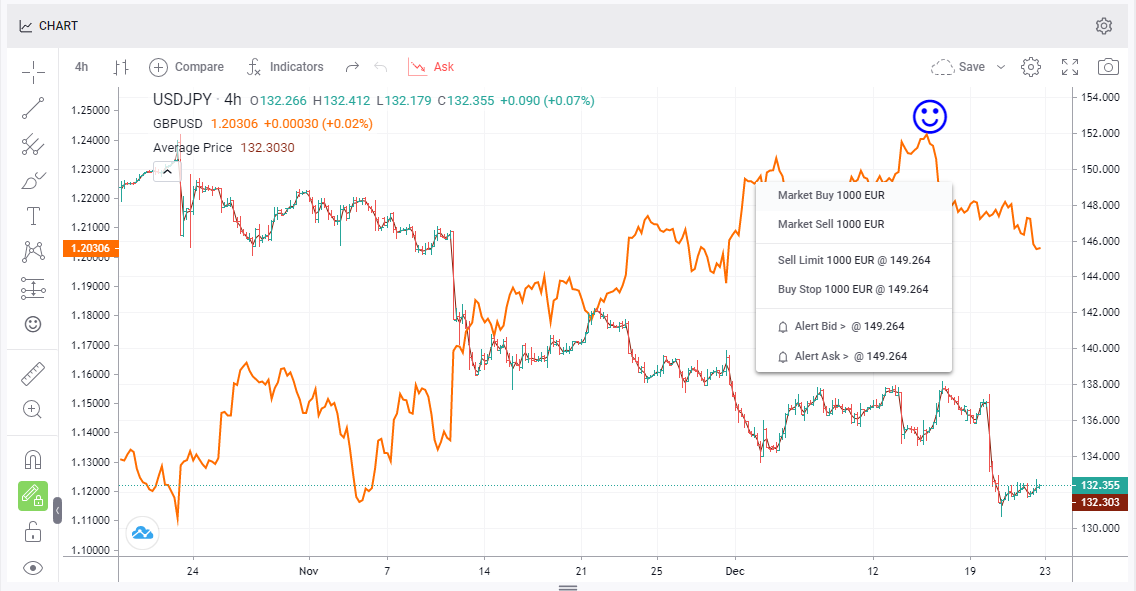
Positions, orders, Alerts
Hover the cursor over the desired quote, right-click the chart to open a market order (Buy/Sell) or pending order (Sell Limit, Buy Stop).
A user can add a Quote alert right-clicking on the chart and selecting the necessary quote. Once this value is reached, the alert will be triggered. The condition for the Quote alert type is that the Bid/Ask price is equal or higher/ lower than the specified value. The actual alerts can be modified and deleted on the Alerts panel.
Related Articles
Chart
The screens in this article are based on the iOS operating system. Android screens may differ slightly. Charts The Chart screen displays the exchange rate dynamics of the selected trading instrument. Charts are widely used for graphical analysis, ...MT4 iOS: Charts
The Chart screen displays the currency rate dynamics of a previously selected currency pair. To access the screen, tap . Crosshair. To switch to the crosshair mode, tap . The crosshair allows you to view the exact date, price and indicator value at ...MT5 Android: Charts
The Chart screen displays the currency rate dynamics of a previously selected currency pair. To access the screen, select Charts in the main menu or tap . Crosshair. To switch to the сrosshair mode, tap . The crosshair allows you to view the exact ...MT5 iOS: Charts
The Chart screen displays the currency rate dynamics of a previously selected currency pair. To access the screen, tap . Crosshair. To switch to the crosshair mode, tap . The crosshair allows you to view the exact date, price and indicator value at ...MT4 Android: Charts
The Chart screen displays the currency rate dynamics of a previously selected currency pair. To access the screen, select Charts in the main menu or tap . Crosshair. To switch to the сrosshair mode, tap . The crosshair allows you to view the exact ...